Developing Mynewt Applications with Visual Studio Code
This guide shows you how to set up Visual Studio Code to develop and debug Mynewt applications. Visual Studio Code is supported on Mac OS, Linux, and Windows. This guide shows you how to:
Install Visual Studio Code.
Install the C/C++ and debugger extensions.
Define task configurations to build Mynewt applications.
Define debugger configurations to debug Mynewt applications.
Launch the debugger.
Prerequisites:
Have Internet connectivity to fetch remote Mynewt components.
Have a computer to build a Mynewt application.
Perform native installation for the Mynewt tools and toolchains. Note: For Windows platforms, ensure that the MinGW bash you install is added to your Windows Path. In addition, if you are using Windows 10 WSL, you must have the MinGW bash before the Windows 10 WSL bash in your Windows Path.
Read the Mynewt OS Concepts section.
Create a project space (directory structure) and populate it with the core code repository (apache-mynewt-core) or know how to as explained in Creating Your First Project.
Complete one of the Blinky Tutorials.
Notes:
This guide is not a tutorial for Visual Studio Code. It assumes you are familiar with Visual Studio Code. If this is your first time using Visual Studio Code, we recommend that you read the Visual Studio Code documentation and tutorials and evaluate whether you would like to use it to develop Mynewt applications.
This guide uses Visual Studio Code on Windows. Visual Studio Code is supported on Linux and Mac OS but may have some variations in the keyboard shortcuts and command names for these platforms.
You can also use the Eclipse IDE to develop Mynewt applications. See hacking-mynewt-in-eclipse for more details. On Windows platforms, you must also ensure the MinGW bash is set in your Windows Path as described in the prerequisites.
Installing Visual Studio Code
Download and install Visual Studio Code from https://code.visualstudio.com/.
Installing the C/C++ and Debugger Extensions
You need to install two extensions:
The C/C++ extension from Microsoft. This extension provides language support such as symbol searching, signatuare help, go to definition, and go to declaration.
The Native Debug extension from webfreak. This extension provides GDB support.
To install the C/C++ extension:
Press
Ctrl-Pto open the search box.Type
ext install cpptoolsin the search box and press Enter. You should see the extension at the top of the list.Click
Installto install the extension.
To install the Native Debugger:
Press
Ctrl-Pto open the search box.Type
ext install webfreak.debugin the search box and press Enter. You should see the Native Debug extension at the top of the list.Click
Installto install the extension.
Defining Tasks for Mynewt Projects
Two main concepts in Visual Studio Code are workspaces and tasks. A workspace represents a folder that is open. You can open multiple workspaces and switch between workspaces.
Tasks allow you to integrate the external tools and operations that are used to build or test your project into Visual Studio Code. Tasks are run from and the task results can be analyzed in Visual Studio Code. Tasks are defined within the scope of a workspace. This means that the tasks you define for a workspace only apply to the given workspace.
Associating a Mynewt Project to a Workspace
For your Mynewt
project, your Visual Studio Code workspace is the Mynewt project base
directory. For example, if you create a project named myproj under
the ~/dev directory, then you open the ~/dev/myproj folder for
your workspace.
Select File > Open Folder, and select the myproj folder from
the Select Folder dialog box to open the folder.
Defining Visual Studio Code Tasks to Build and Debug Mynewt Applications
You define Visual Studio Code tasks to build and debug your Mynewt targets in Visual Studio Code. We use the Blinky application for the Arduino Zero board from the Blinky On Arduino Zero Tutorial to illustrate how to define the tasks to build and debug the Arduino blinky bootloader and application targets.
Perform the following steps to create the tasks to build and debug the Arduino blinky bootloader and appliction targets:
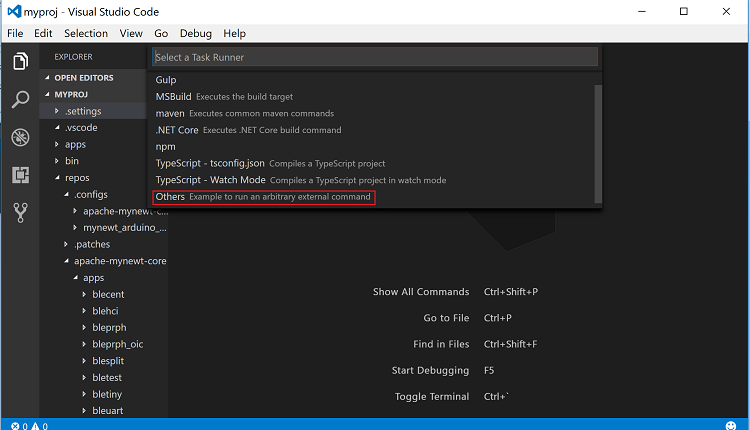
Step 1: Press Ctrl-Shift-P, type task, and select
Tasks:Configure Task Runner from the search results.
Step 2: Select Others (scroll down to the bottom of the list) to create a task runner for external commands.
Tasks are defined in the tasks.json file. You should see the
.vscode folder created in the MYPROJ folder and a tasks.json
file created in the .vscode folder. The tasks.json file has the
following default values.
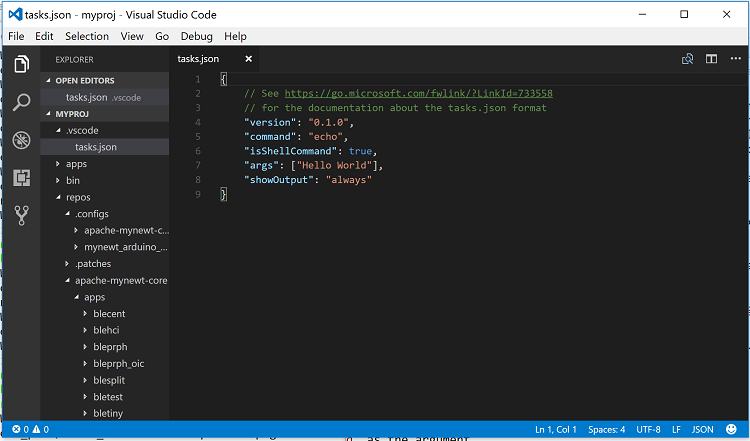
The sample tasks.json file defines a simple task that runs the echo
command with “Hello World” as the argument.
Step 3: Delete the content from the tasks.json file, add the
following definitions, and press Ctrl-S to save the file.
{
    "version": "0.1.0",
    "command": "newt",
    "echoCommand": true,
    "isShellCommand": true,

    "tasks":[
        {
            "taskName": "build_arduino_boot",
            "args": ["build", "arduino_boot"],
            "suppressTaskName": true
        },
        {
            "taskName": "build_arduino_blinky",
            "args": ["build", "arduino_blinky"],
            "isBuildCommand": true,
            "suppressTaskName": true
        },
        {
            "taskName": "create_arduino_blinky",
            "args": ["create-image", "arduino_blinky", "1.0.0"],
            "suppressTaskName":true
        },
        {
            "taskName": "debug_arduino_blinky",
            "args": ["debug", "arduino_blinky", "-n"],
            "suppressTaskName": true
        }
    ]
}
The tasks.json file specifies the tasks that are run to build and
debug the Arduino blinky targets. Each task runs a newt command. The
newt command to run and the arguments for the newt command are
passed in the args property for each task.
The following tasks are defined in this example:
build_arduino_boot: Runs the
newt build arduino_bootcommand to build the arduino_boot target.build_arduino_blinky: Runs the
newt build arduino_blinkycommand to build the arduino_blinky target.Note: This task sets the
isBuildCommandproperty totrue. This is an optional property that, when set to true, allows you to run the Tasks: Run Build Task(Ctrl-Shift-B) command to start the task.create_arduino_blinky: Runs the
newt create-image arduino_blinkycommand to create the image file.debug_arduino_blinky: Runs the
newt build arduino_blinky -ncommand to debug the arduino_blinky target. The-nflag is specified to start only the GDB server and not the GDB client. We will launch the GDB client from Visual Studio Code.
For more information on tasks and all supported properties, see the Visual Studio Code Task documentation.
Running a Task
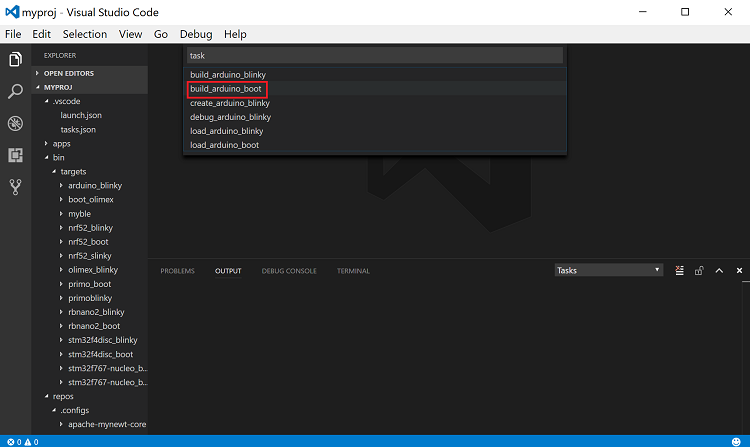
To run a task, press Ctrl-Shift-P, type task on the search box,
and select Tasks: Run Task. The tasks that you define in the
tasks.json file are listed. Select the task to run.
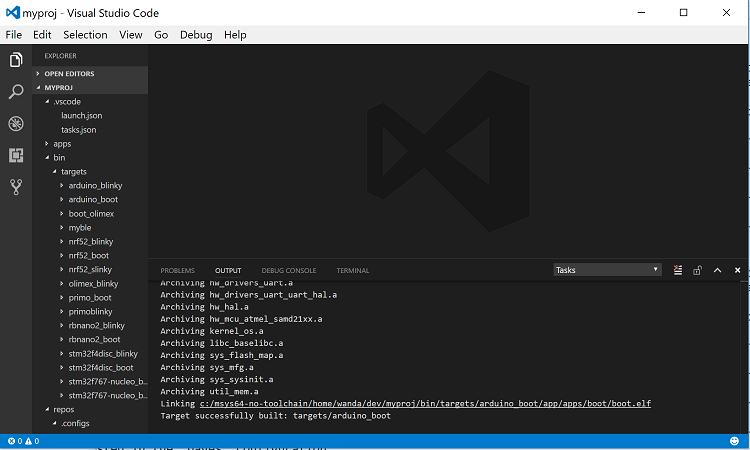
The following is an example of running the build_arduino_boot task:
Note: To run the build_arduino_blinky task, you can use the
keyboard shortcut Ctrl-Shift-B because the task has the property
isBuildCommand set to true.
Defining Tasks for Other Newt Commands
Other newt commands, such as the newt load command, do not need to
run from within Visual Studio Code. You can define a task for each
command as a convenience and run the command as a task, or you can run
the newt command on the command line from the Visual Studio Code
integrated terminal or an external terminal.
To create the tasks for the newt load arduino_boot and
newt load arduino_blinky commands, add the following definitions to
the tasks.json file:
[
        {
            "taskName": "load_arduino_boot",
            "args": ["load", "arduino_boot"],
            "suppressTaskName":true
        },
        {
            "taskName": "load_arduino_blinky",
            "args": ["load", "arduino_blinky"],
            "suppressTaskName":true
        },
]
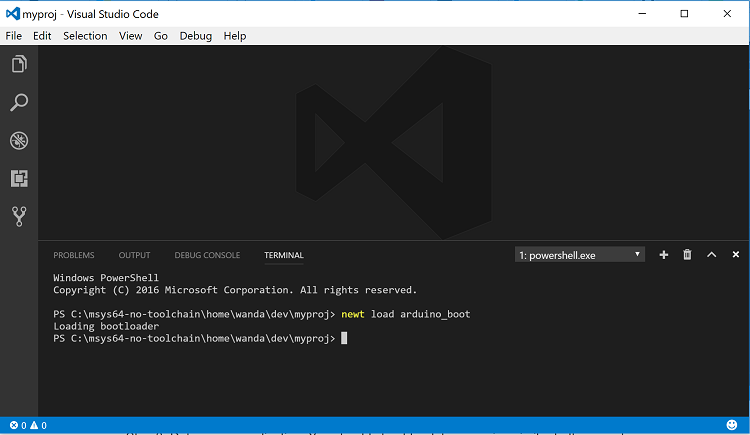
To run a command from the Visual Studio integrated terminal, instead of
starting a task, press Ctrl-` to launch the integrated terminal and
enter the command on the prompt:
Defining Debugger Configurations
You need to define a debugger configuration to launch the GDB debugger from within Visual Studio Code:
Step 1: Select Debug > Open Configuration, and select the GDB environment.
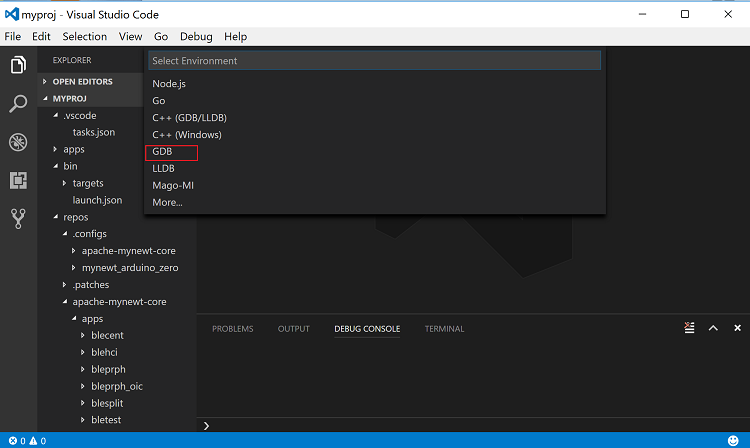
You should see a default launch.json file created in the .vscode
folder.
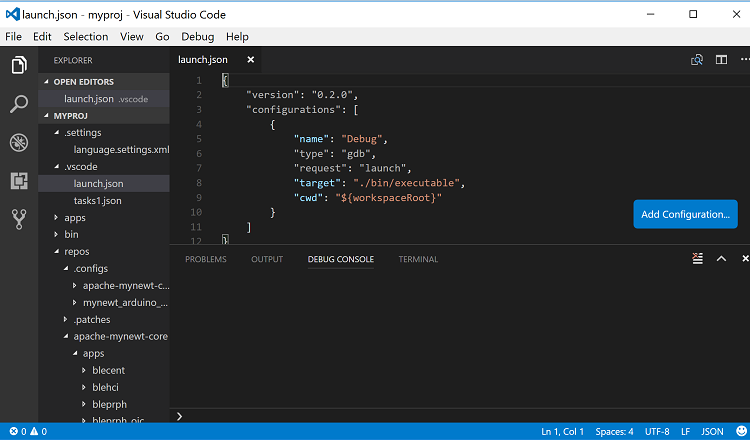
Step 2: Delete the content from the launch.json file, add the
following definitions, and press ‘Ctrl-S’ to save the file.
{
    "version": "0.2.0",
    "configurations": [
        {
            "name": "gdb_arduino_blinky",
            "type": "gdb",
            "request": "attach",
            "executable": "${workspaceRoot}\\bin\\targets\\arduino_blinky\\app\\apps\\blinky\\blinky.elf",
            "target": ":3333",
            "cwd": "${workspaceRoot}",
            "gdbpath": "C:\\Program Files (x86)\\GNU Tools ARM Embedded\\4.9 2015q2\\bin\\arm-none-eabi-gdb.exe",
            "remote": true

        }
    ]
}
This defines a gdb_arduino_blinky debugger configuration. It
specifies:
The debugger is type gdb.
To use the
blinky.elffile for the executable.To use port 3333 to connect with the remote target.
To use arm-none-eabi-gdb for the GDB program.
Debugging Your Application
To debug your application, start the GDB server and launch the GDB session from Visual Studio Code. For the the arduino blinky example, perform the following:
Step 1: Run the debug_arduino_blinky task to start the GDB server. Perform the following:
Press
Ctrl-Shift-Pand typetaskin the search box.Select Tasks:Run Task > debug_arduinoblinky.
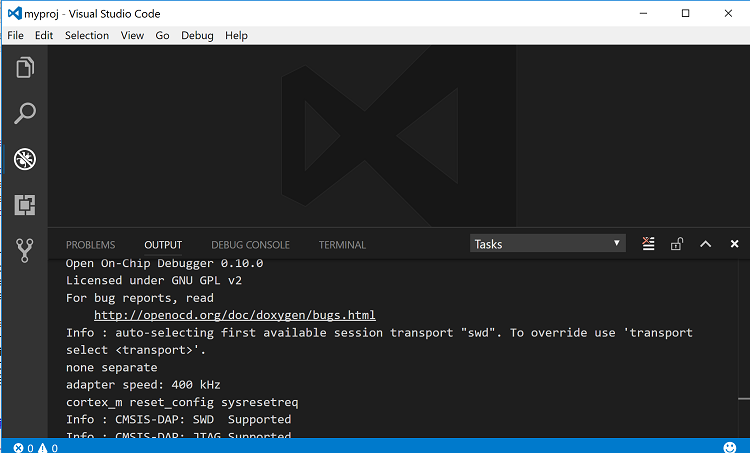
Press
Ctrl-Shift-Uto open the Output Panel and see the OpenOCD GDB Server output.
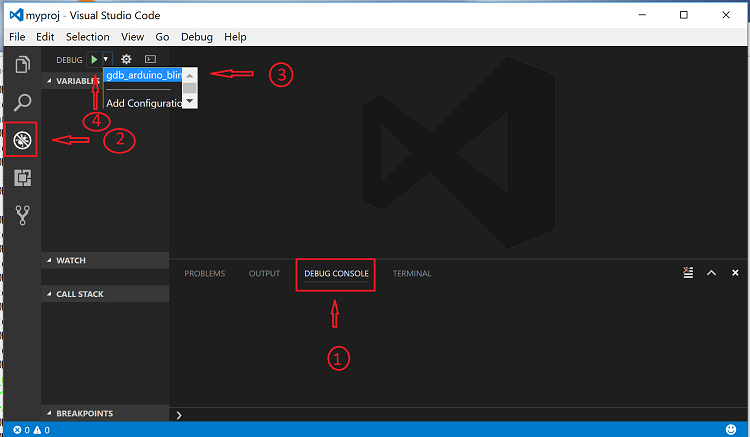
Step 2: Start the GDB session. Perform the following:
Press
Ctrl-Shift-Yto view the Debug Console.Press the Debugging icon on the activity bar (Ctrl-Shift-D) to bring up the Debug Side Bar.
Select
gdb_arduino_blinkyfrom the DEBUG drop down menu.Press the green play button to start the gdb session.
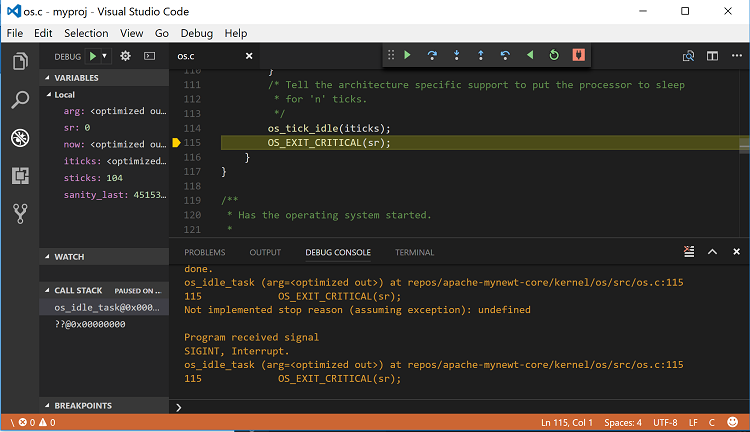
Step 3: Debug your application. You should see a debug session similar to the one shown below:
For more information on how to use the Visual Studio Code Debugger, see the Visual Studio Code debugging documentation.
Working with Multiple Mynewt Applications
As mentioned previously, each mynewt project corresponds to a Visual
Studio Code workspace. If you have multiple Mynewt application targets
defined in same project, you will need to define build and debug tasks
for each target in the tasks.json file and debugger configurations
for the targets in the launch.json file for the workspace. If you
have a different Mynewt project for each mynewt application, you will
need to define build and debug tasks in the tasks.json file and the
debugger configuration in the launch.json file for each workspace.